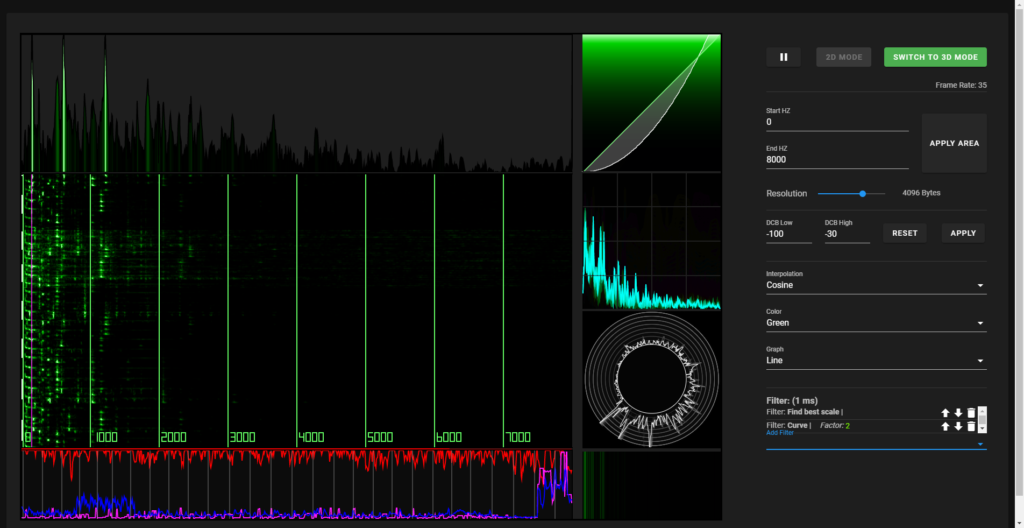
What is the FSV?:
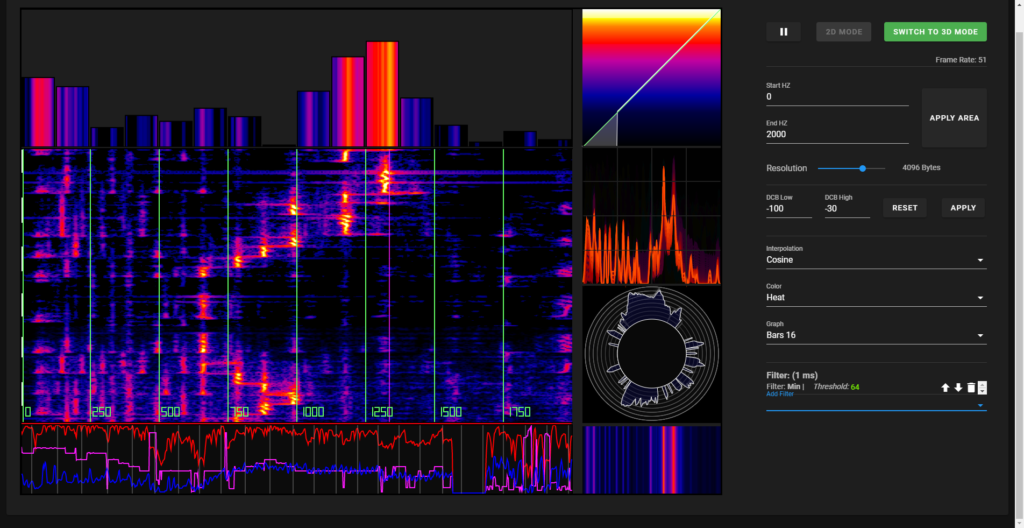
The Frequency Spectrum Visualizer (FSV) is a free and open source hobby project to visualize audio signals.
Highlights:
– OS: Linux, Windows
– Resolution from 1024 (30 Hz) to 8192 (3 Hz)
– Spectrum from 0 to 24 kHz
– Currently 15 filter
– 6 Color Modes
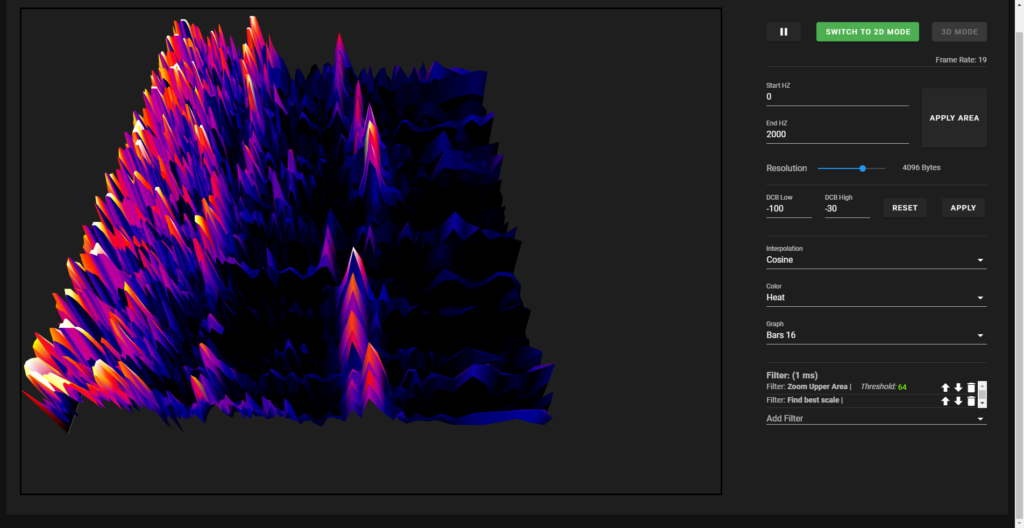
– 3D Mode
Technologies used:
– YARN Package manager
– Node.js
– p5.js
– vue.js
– vuetify
– FFT from Web APIs
Feature ideas:
– Song detection
– Beat detection
– Piano songs to music sheet
Get involved:
The FSV is an open source project. If you have any ideas write me or create a merge request. At the moment I’m refactoring most of the project (Status 70%) and adding comments (Status 20%).
Third Party:
I recommend to use Voicemeeter to map the audio output on as a microphone:
https://vb-audio.com/Voicemeeter/
Important:
The FSV will always use your main audio input. If you want to use Voicemeeter please select the „VoiceMeeter Output“ as your standard device under Sounds->Recording.
GitLab repository:
https://gitlab.com/0x222222/frequency-spectrum-visualizer
Install:
Install link fehlt